Intelligent Systems · Project P4 · November 2026
A dispatcher has twenty deliveries with time windows and three vans. A neural network learns how long New York trips take at each hour, a constraint solver gives each order a van, and A* finds each van's best stop order. When a route runs late, the system learns a new rule and plans again.
Each part answers one question: how long a trip takes, which van takes an order, and in what order a van drives.
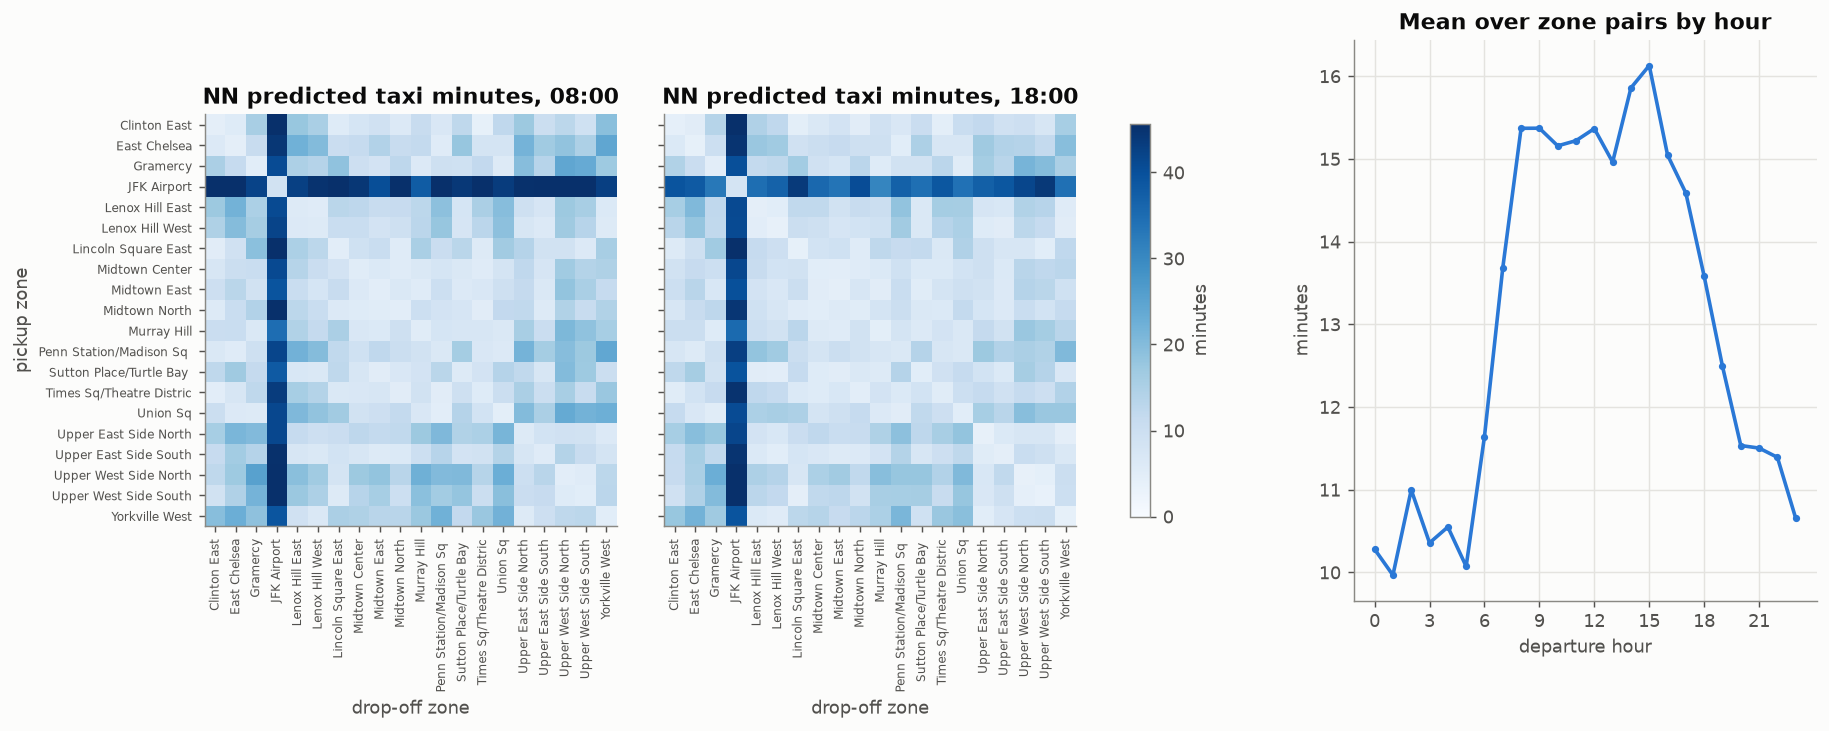
A numpy MLP predicts trip minutes from pickup zone, drop-off zone, hour, weekday and typical distance. Output: a 24 × 20 × 20 hourly time matrix.
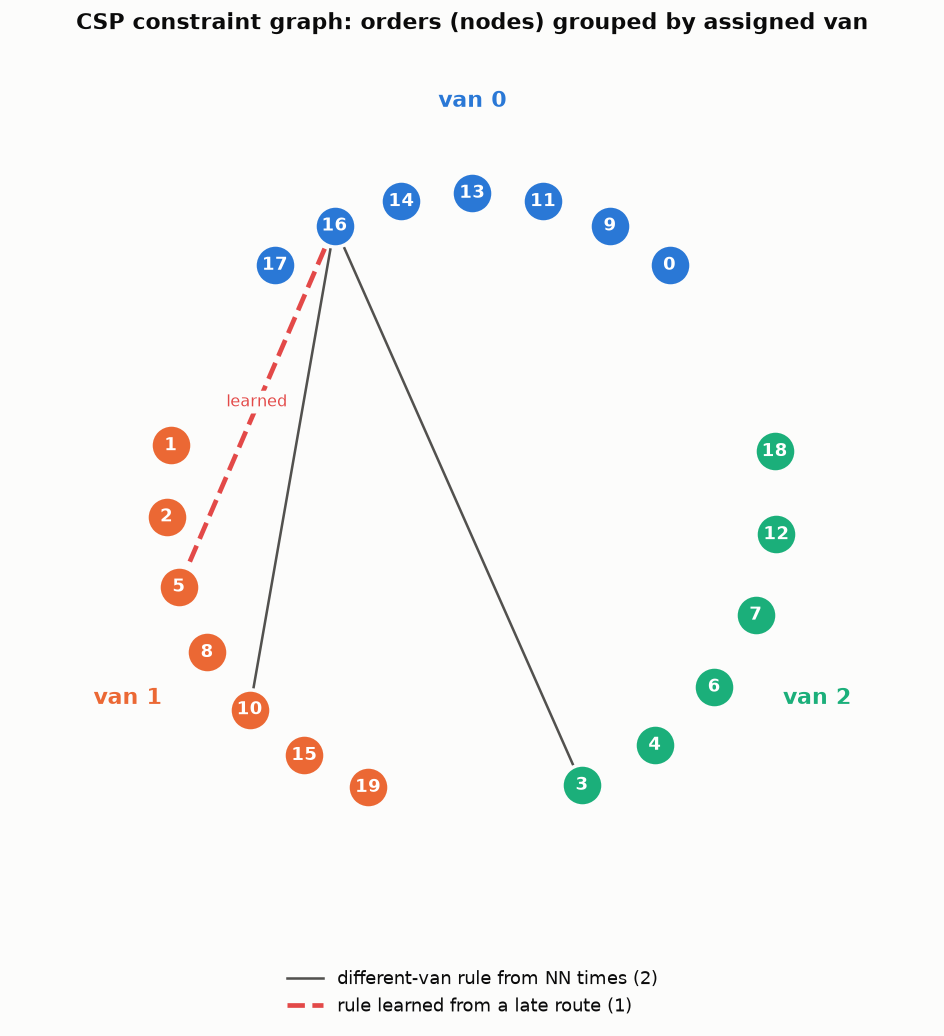
Variable = van per order. Rules: the window is reachable from the depot, capacity, at most 10 stops, and "different van" pairs derived from the NN times. Backtracking, Forward Checking and AC-3 are switchable.
State = (stop, visited set, clock). Cost = travel plus waiting. An admissible time-dependent heuristic; UCS and Greedy as baselines.
NYC Taxi & Limousine Commission trip records, January 2022. From 2.46 M yellow-taxi trips we keep weekdays, durations of 1 to 120 minutes and the 20 busiest zones (19 in Manhattan plus JFK), about 300 k trips. The split is by day: three weeks to train, the last week to test.
Orders, time windows, demands and van capacities are generated by a seeded generator (15, 20 and 30 orders × 10 seeds). Taxi times only approximate van times, so we apply a documented van factor of 1.2.
| Step | Trips |
|---|---|
| Yellow taxi, Jan 2022 | 2.46 M |
| Weekdays, 1–120 min, valid zones | filtered |
| Both ends in the top-20 zones | ≈ 300 k |
| Test set (last week) | 93,592 |
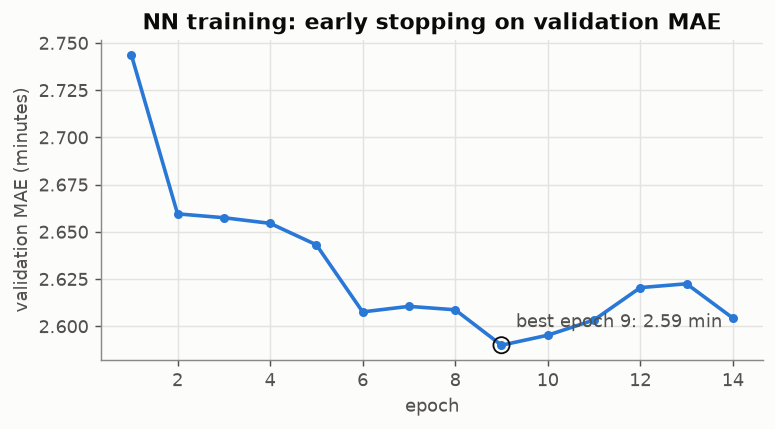
A hand-written numpy MLP: zone one-hots (acting as embeddings), hour and weekday encodings and the pair distance, trained with Adam, Huber loss and early stopping. Compared against three baselines on the same held-out week.
| Model | MAE (min) | RMSE | Bias |
|---|---|---|---|
| NN (MLP) | 3.23 | 5.44 | −1.87 |
| Historical average (pair, hour) | 3.24 | 5.42 | −1.61 |
| Distance-linear | 4.14 | 6.40 | −1.62 |
| Global mean | 5.45 | 8.88 | −1.31 |
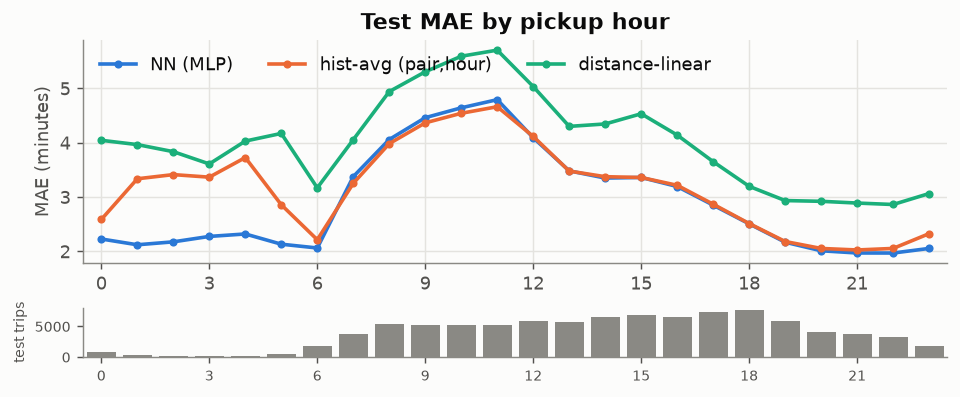
Overall, the NN is tied with the historical lookup table. Its advantage shows on rare (pair, hour) cells with fewer than 3 training trips: MAE 3.25 vs 4.69. Every model under-predicts the slower test week by about 1.7 minutes.
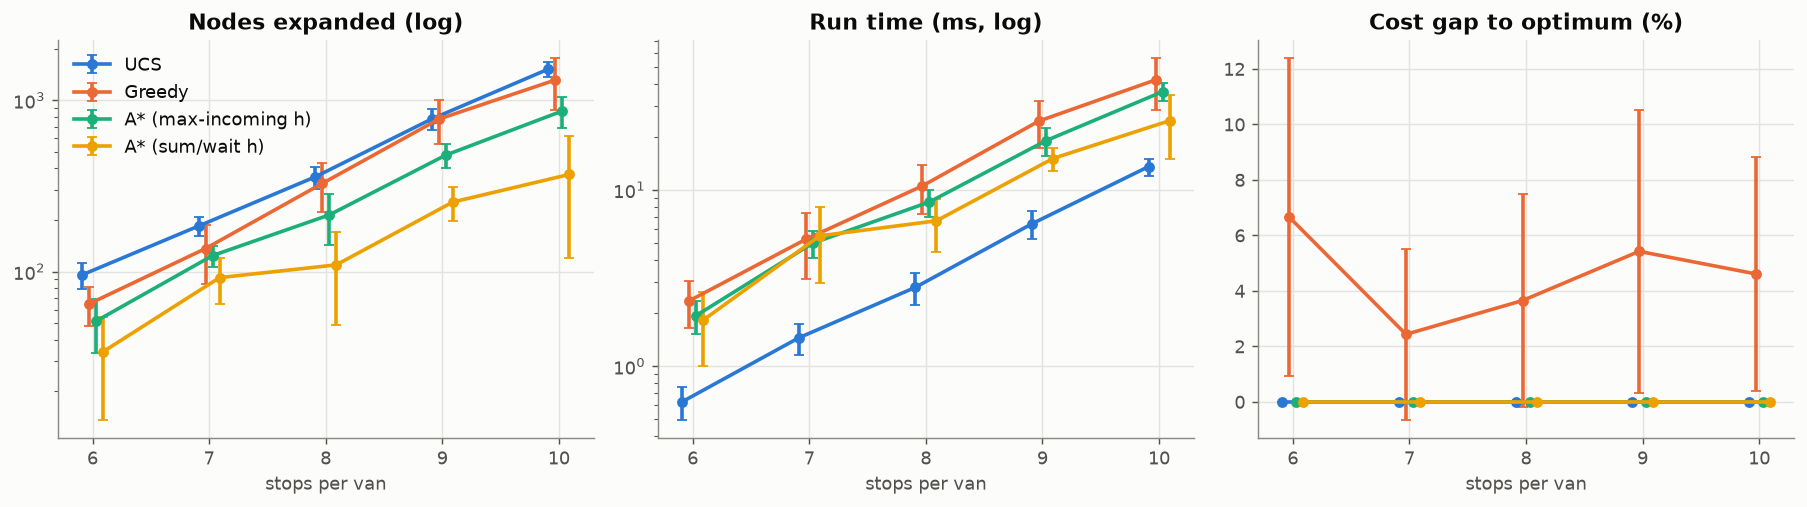
The obvious heuristic, "cheapest incoming trip at the current hour", is not admissible when travel times change through the day (our counter-example: 40 > 35). Our fix takes the minimum over all later departure times and adds a waiting bound. Step through the real A* trace for van 0 on the demo day:
f = g + h stays at 461 while h hands its estimate over to g. The bound is tight from the start because the time windows force most of the waiting.
| Stops | Algorithm | Nodes expanded | Gap to optimum |
|---|---|---|---|
| 6 | UCS | 95.5 ± 16.5 | 0% |
| 6 | Greedy | 64.7 ± 16.4 | 6.7% |
| 6 | A* | 34.0 ± 20.4 | 0% |
| 10 | UCS | 1,519 ± 161 | 0% |
| 10 | Greedy | 1,312 ± 440 | 4.6% |
| 10 | A* | 368.7 ± 249 | 0% |
10 seeds per size. A* matched brute force in 30/30 checks. At this size UCS is still faster in milliseconds, because each A* node costs more to evaluate.

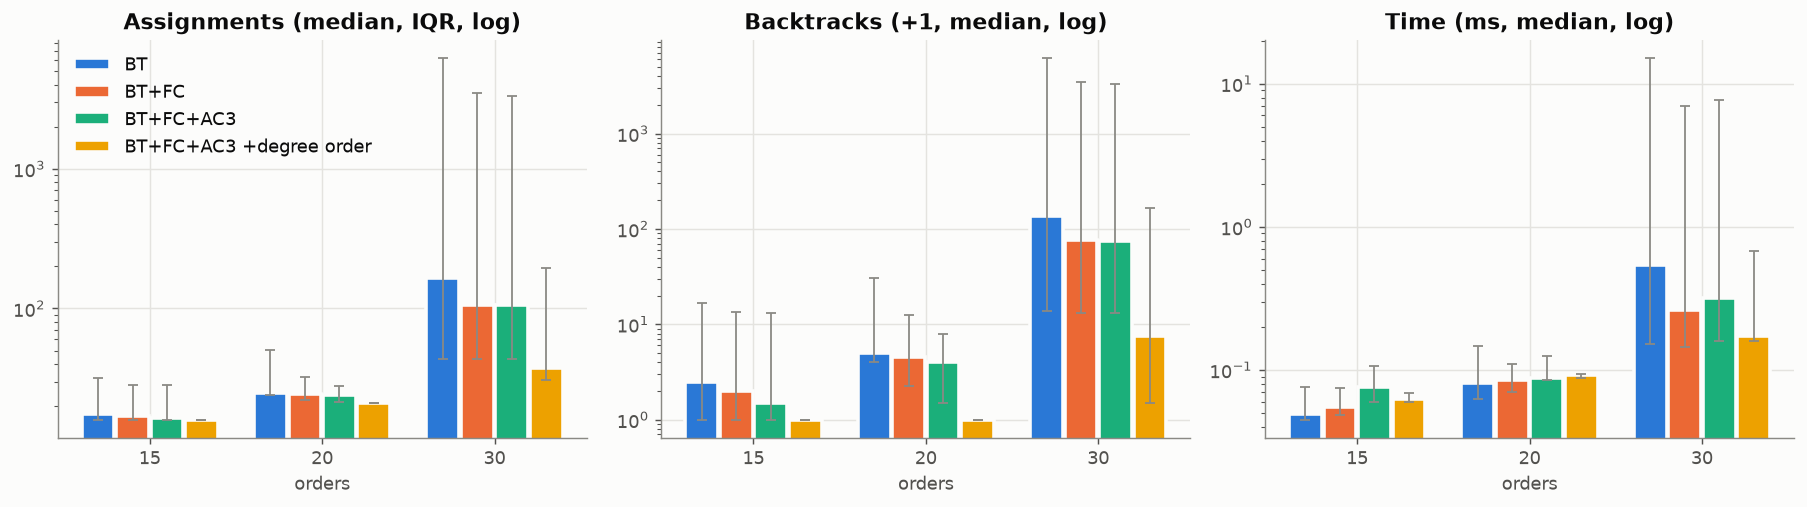
The same hard rush-hour instance (20 orders, windows 09:00 to 12:00, zero spare capacity, 4 rules from the NN), solved four ways. Pick a solver:
Bars show assignments tried. With only 3 values per variable and "≠" constraints AC-3 adds little; forward checking's capacity pruning and most-constrained-first ordering do most of the work.
| Orders | Solver | Median assignments | Solved / unsat / limit |
|---|---|---|---|
| 30 | BT | 165.5 | 8 / 0 / 2 |
| 30 | BT + FC | 105.5 | 8 / 0 / 2 |
| 30 | BT + FC + AC-3 | 104.5 | 8 / 1 / 1 |
| 30 | + most-constrained first | 36.5 | 9 / 1 / 0 |


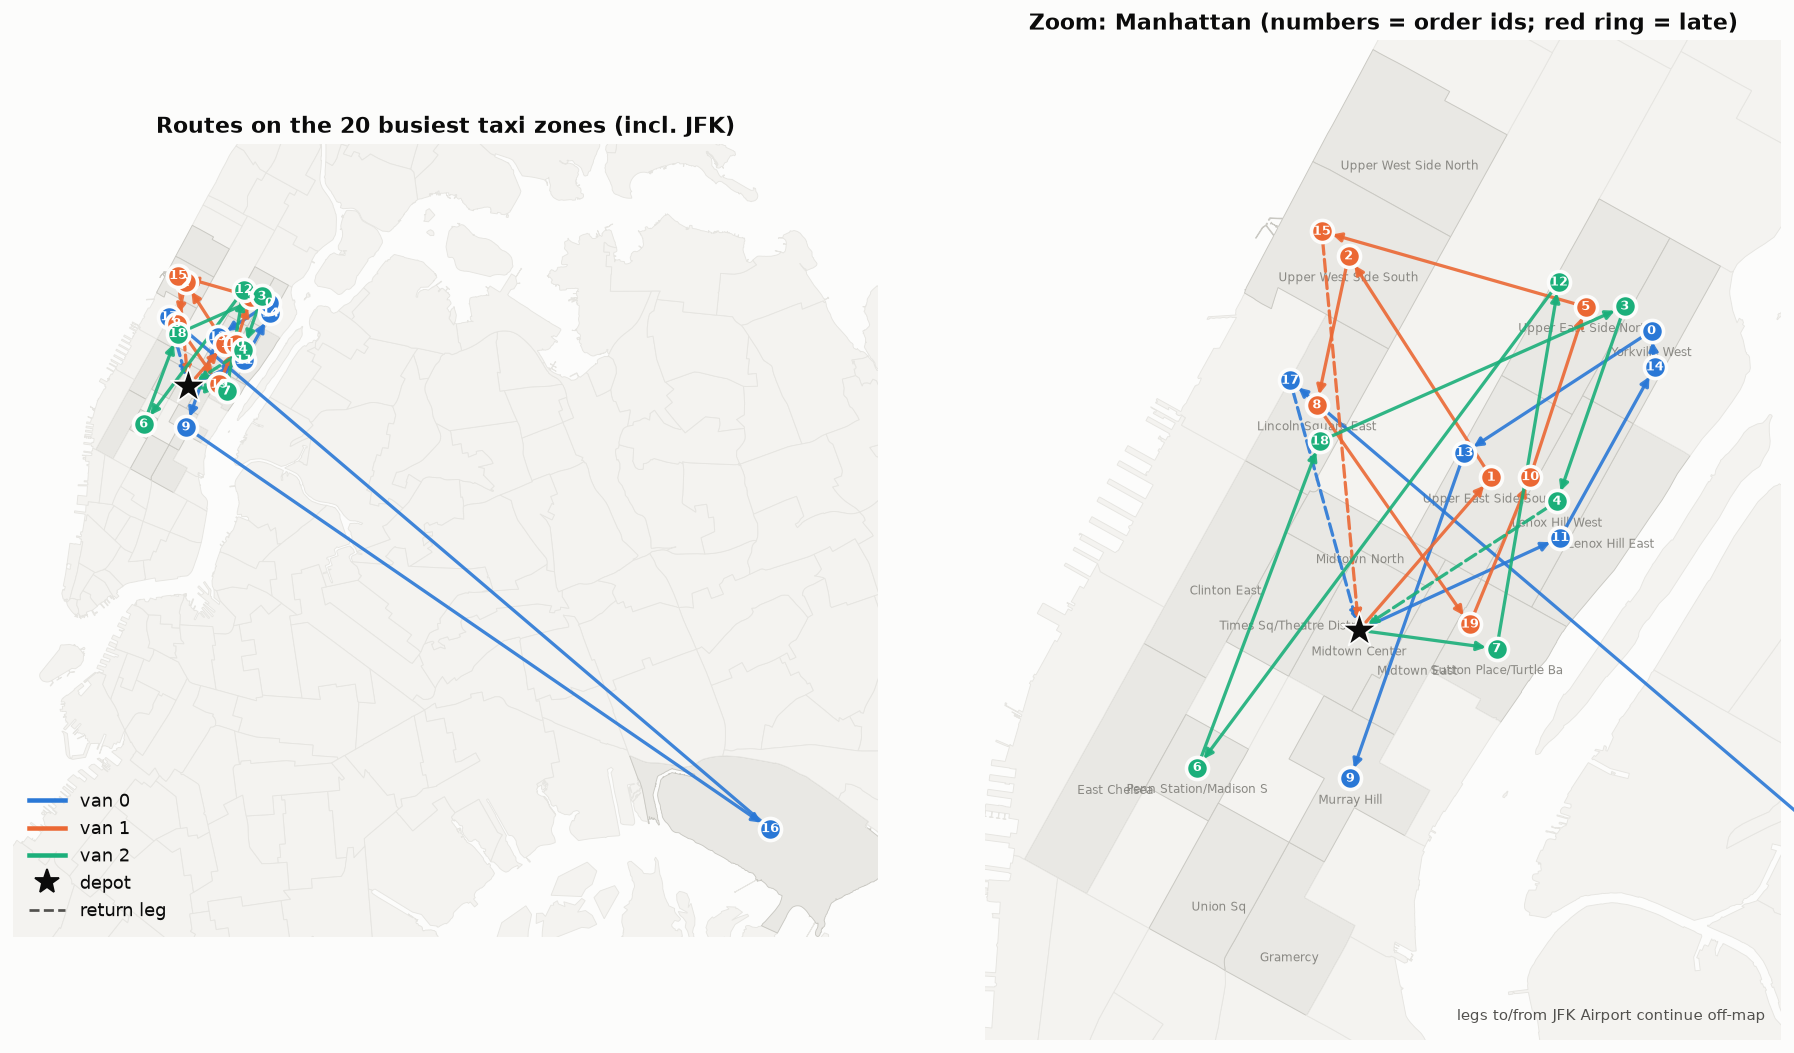
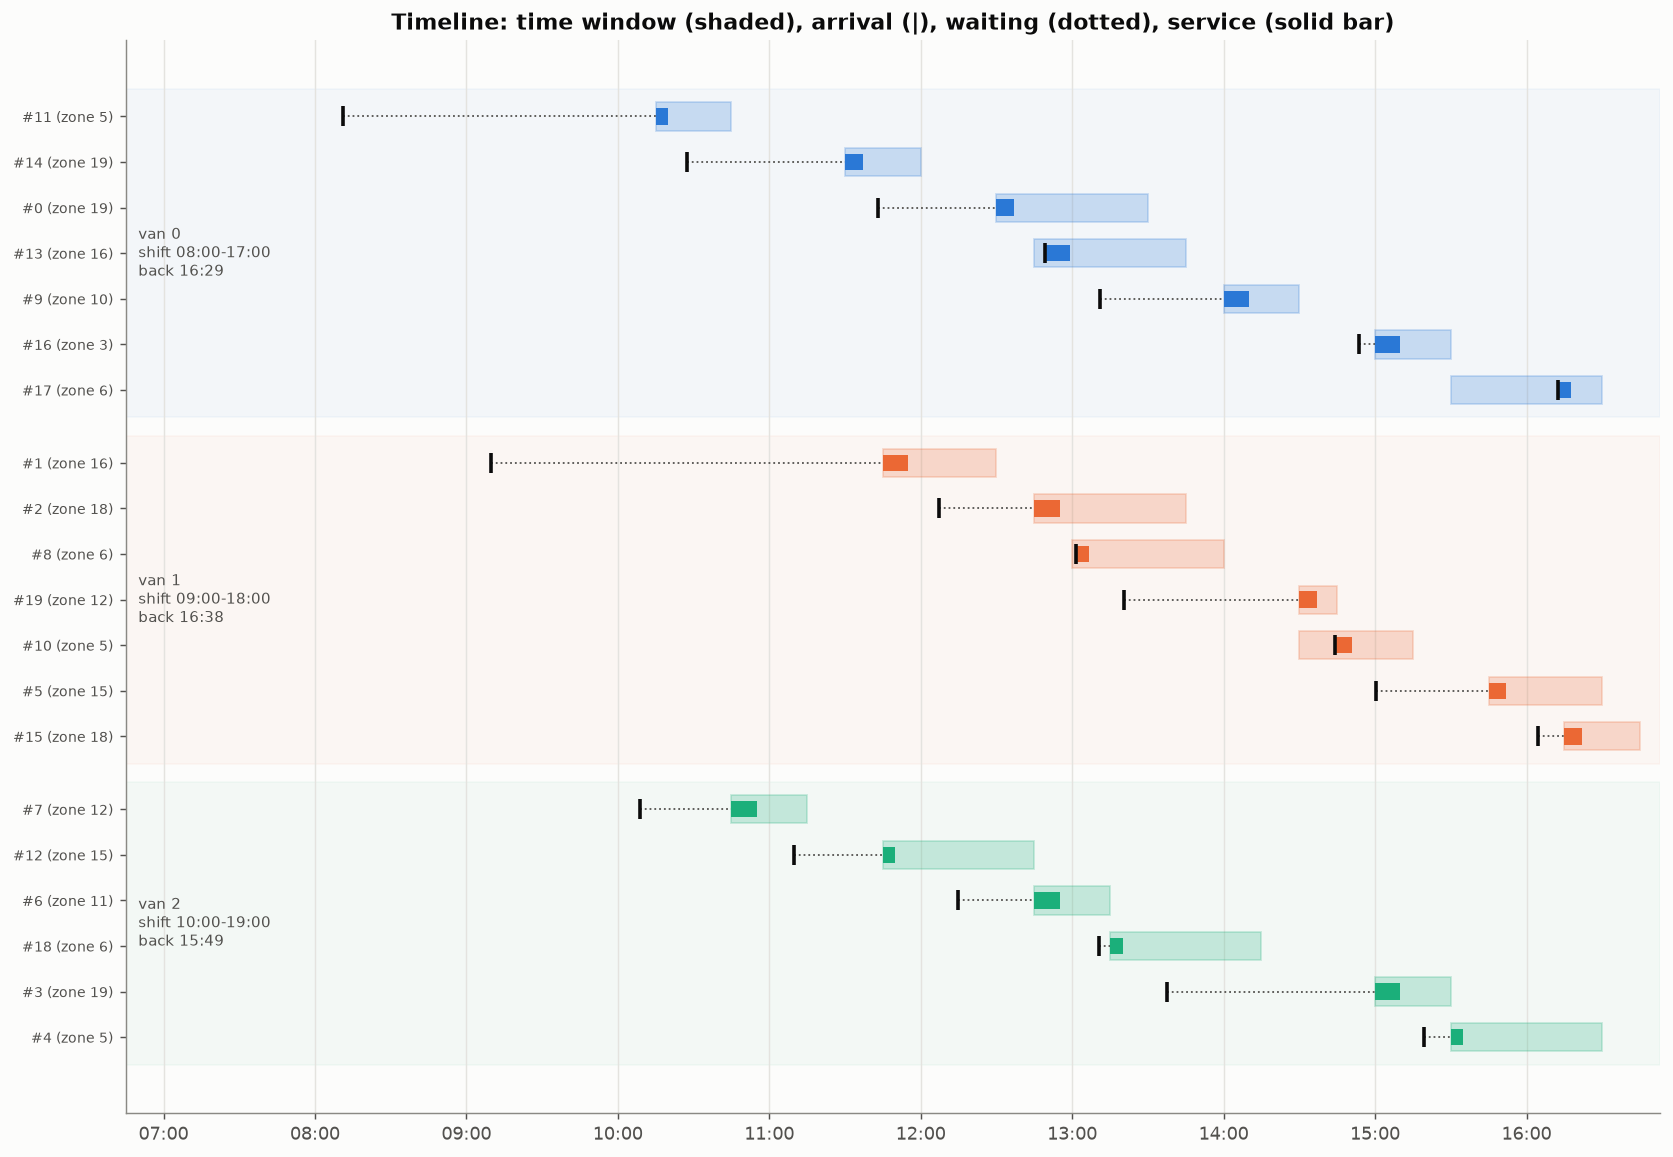
In loop 1, van 0 would serve JFK Airport (15:00–15:30) and then Upper East Side North (window from 15:45): 2.1 minutes late. That pair becomes a rule; in loop 2 every order is on time.


Run with --impossible: order 0 moves to JFK with a window of 08:00–08:20.
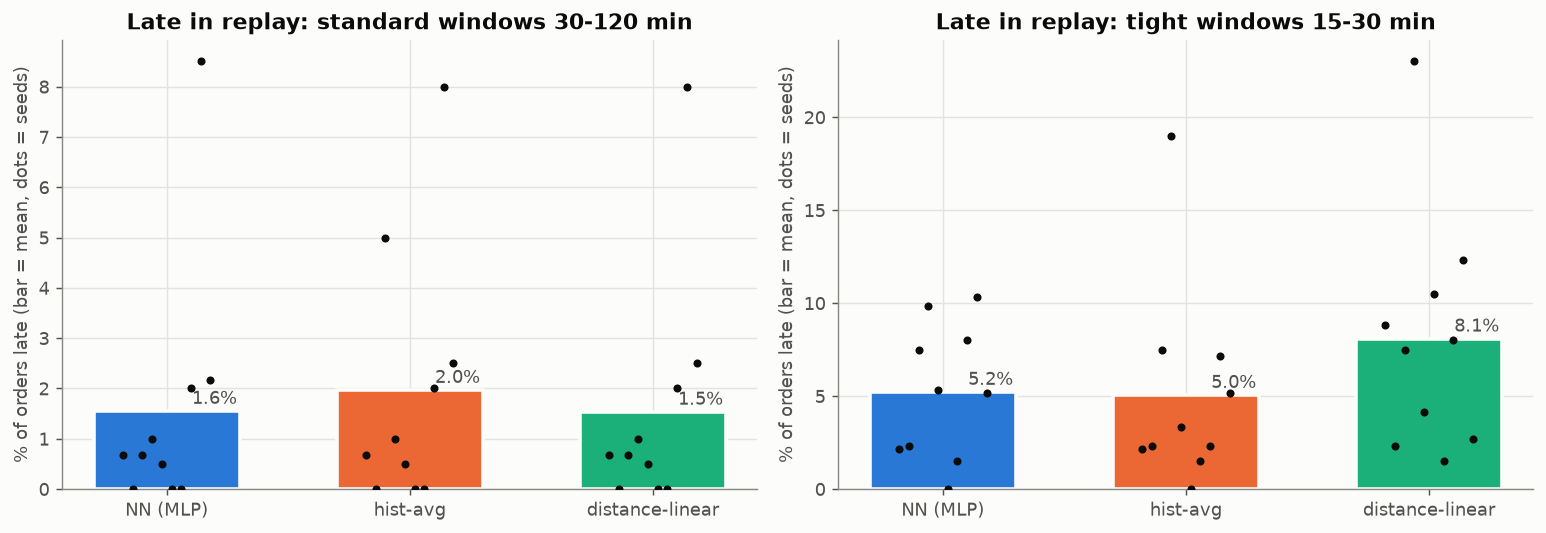
Each plan is replayed with real trip durations drawn from the held-out week, and late deliveries are counted. Experiment 3, 10 seeds per scenario:
With tight windows, hour-aware travel times (NN or historical) are late about 5% of the time versus 8% for distance only. With loose windows all three models are close, so the extra modelling only pays when the schedule is tight.

Python 3.13, plain numpy (no PyTorch or scikit-learn). All randomness is seeded.